




AVD Health Checks using Azure Portal | Monitoring | KQL Queries
Let’s check AVD Health Checks using Azure Portal, Azure Monitor, Log Analytics, and KQL Queries. I hope the information provided in this post will help you with Azure Virtual Desktop troubleshooting scenarios.
The AVD health checks and monitoring options can also be automated. The automation part of monitoring is not covered in this post. However, this post will get the details about AVD daily monitoring checks.
You can also get the AVD utilization details from Azure Monitor, and Log Analytics KQL queries. THIS POST ALSO SHARES A sample KQL query to get the top 10 connection errors of AVD. You can also get Top 10 Feed error details from the Log Analytics workspace.
In the Azure portal, you can see four (4) basic AVD monitoring checks available for AVD session hosts (VM Status). You will need to go to individual session hosts to check the status. Log analytics is where you will get the details about ten (10) AVD monitoring checks.
It’s really interesting to see monitoring checks related to WebRTC Redirector (Teams media optimization-related component), FSLogix, and MSIX App attach. Y log analytics workspace provides CPU and Memory utilization reports for AVD estate, as explained in the below section of this post.
- FIX: AVD Azure AD Joined VM Login Issue With Error Code 0x9735
- AVD VM RD Client Connection Error 0x83886181
- Fix AVD Could not Connect to Session Desktop Admin has Restricted the Type of Logon
- Fix AVD Refreshing Your Token Error | Couldn’t Connect to Session Desktop
Azure Portal AVD Session Host Health Checks
You have a basic AVD session Host health check option (VM Status) in the Azure Virtual Desktop portal. FOUR (4) monitoring checks are exposed with this health check option. You can have more detailed health check options in the log analytics workspace.
You can quickly look at the four health checks performed from Azure Portal – Azure Virtual Desktop – Host Pools (Select any of the host pools from the list) – Session Hosts – Click on Session Host’s hyperlink.
As you can see in the screenshot below, VM status is where you can get the details of the AVD Health Checks.
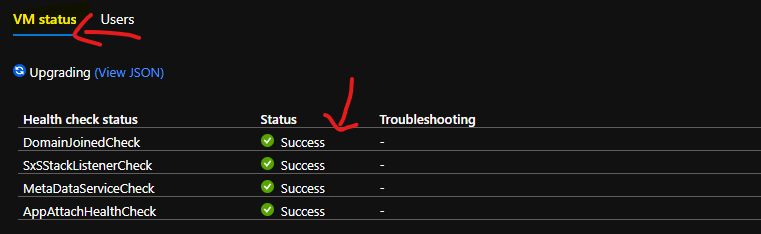
Domain Joined Check – SessionHost healthy: is joined to the domain
SxS Stack Listener Check – SessionHost healthy: SessionHost healthy: SxS stack listener is ready
Meta Data Service Check – The Azure Instance Metadata Service (IMDS) is presumed available
App Attach Health Check – SessionHost healthy: MSIX packages have been properly staged.”
| AVD Health checks status | Status | Troubleshooting |
| DomainJoinedCheck | Success | |
| SxSStackListenerCheck | Success | |
| MetaDataServiceCheck | Success | |
| AppAttachHealthCheck | Success |
The following is one of the common error messages you get if the Session host VM is not reachable. You will need to check the VMs available if you get this message as a first step.
Session host information is not available because the VM cannot be reached. This can be a result of the VM being deallocated or hibernated. It is also possible that a networking error is blocking connectivity.

AVD Health Checks using Azure Monitoring – Log Analytics
AVD uses Azure Monitor for monitoring and alerts like many other Azure services. This lets admins identify issues through a single interface. You have a better option to perform AVD health checks. You will need to enable Azure Monitor and send monitoring data to the log analytics workspace for this AVD health checks option.
TEN (10) health checks are performed if we use this method. This is a more comprehensive list. You can launch this health check from the Log Analytics workspace. The out of box KQL query HealthChecks of Session Host helps to check the status of session hosts.
| AVD Health checks status |
| DomainJoin |
| Domain Trust |
| FSLogix |
| SxS Stack |
| URL Check |
| Geneva Agent |
| Domain Reachable |
| WebRTC Redirector |
| SxSStack Encryption |
| IMDS Reachable |
| MSIX Package Staging |
You will need to log into the Azure portal, navigate to the Log Analytics Workspace where the managed devices are part, and click on the Logs tab. You can click on the Query tab from the popup window. You can click on the query called HealthChecks of Session Host.
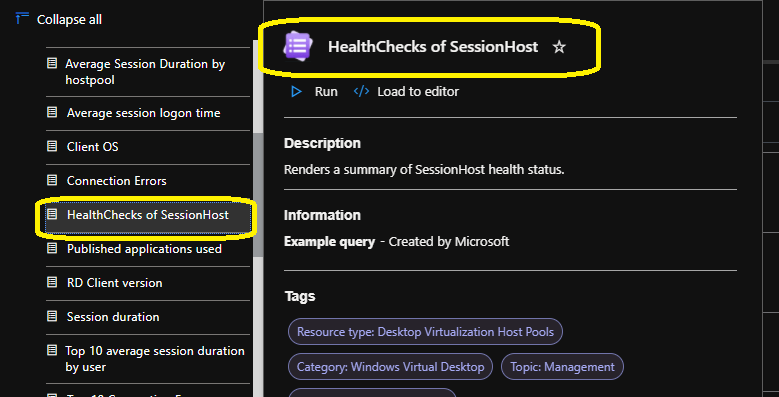
Let’s have a quick look at the KQL query to check the status of AVD Session Hosts.
// AVD Health Checks of SessionHost
// Renders a summary of SessionHost health status.
let MapToDesc = (idx:long) {
    case(idx == 0,  "DomainJoin",
         idx == 1,  "DomainTrust",
         idx == 2,  "FSLogix",
         idx == 3,  "SxSStack",
         idx == 4,  "URLCheck",
         idx == 5,  "GenevaAgent",
         idx == 6,  "DomainReachable",
         idx == 7,  "WebRTCRedirector",
         idx == 8,  "SxSStackEncryption",
         idx == 9,  "IMDSReachable",
         idx == 10, "MSIXPackageStaging",
         "InvalidIndex")
};
WVDAgentHealthStatus
| extend var = tostring(SessionHostHealthCheckResult)
| extend result = parse_json(var)
| mv-expand result
| extend HealthCheckName = tolong(result.HealthCheckName)
| extend HealthCheckResult = tolong(result.HealthCheckResult)
| extend HealthCheckDesc = MapToDesc(HealthCheckName)
| summarize count(), min(TimeGenerated), max(TimeGenerated) by HealthCheckResult, HealthCheckName, HealthCheckDesc, SessionHostName
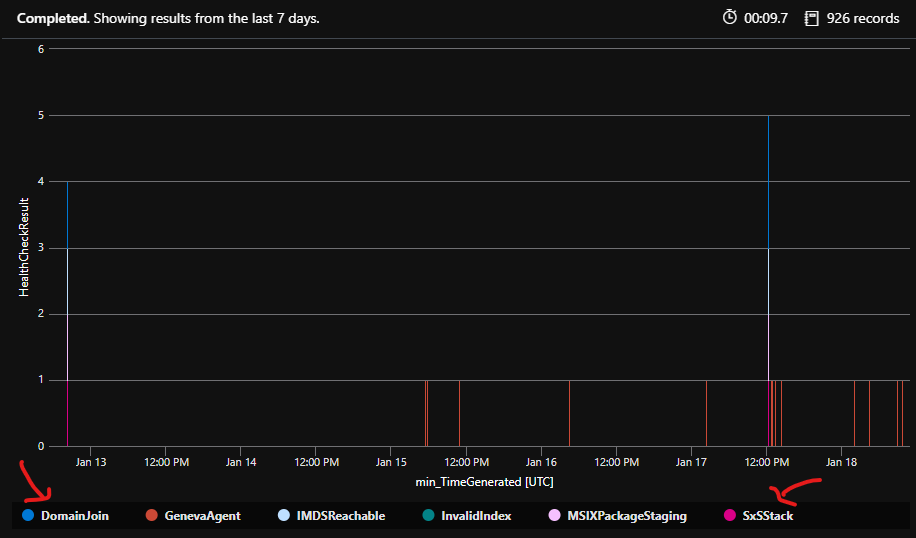
As you can see, the below graph shows the health of components that are enabled for your AVD deployment. I don’t see FSLogix, WebRTCRedirector, etc., in the below picture.
AVD Top 10 Connection Errors Report
As mentioned above, AVD uses Azure Monitor for monitoring and alerts like many other Azure services. You will need to enable Azure Monitor to get the following data.
You can use the following documentation to learn more about the Azure Monitor setup for AVD. Use Monitor Azure Virtual Desktop Monitor – Azure | Microsoft Docs.
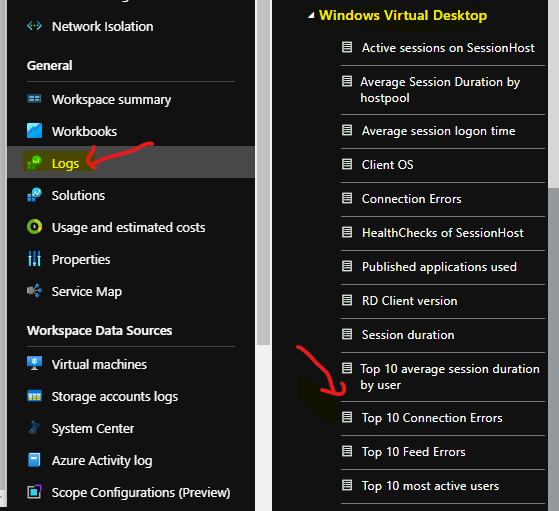
You will need to log into the Azure portal, navigate to the Log Analytics Workspace where the managed devices are part, and click on the Logs tab.
You can click on the Query tab from the popup window. You can get some sample KQL queries to get more details about AVD utilization reports, connection errors, feed errors, etc.
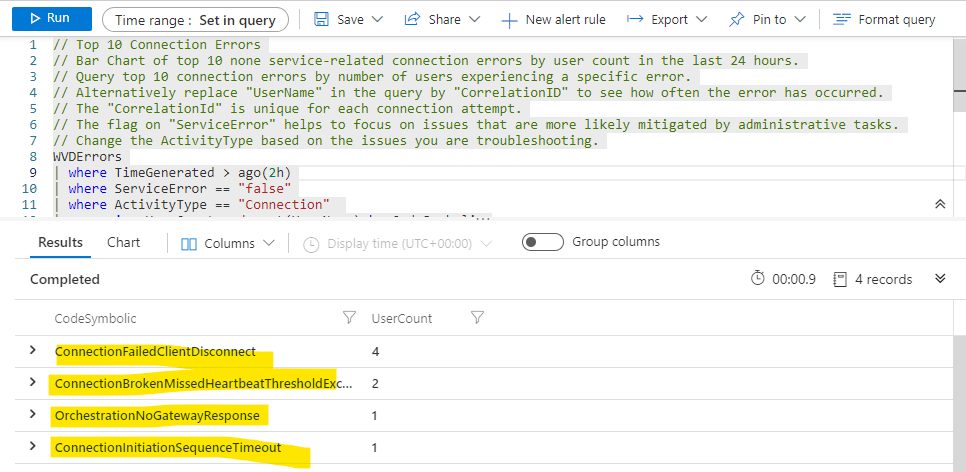
The following KQL query gives you the details of the top 10 AVD connection errors for the last 2 hours (2h is the value used in the following query.)
//
// Bar Chart of top 10 none service-related connection errors by user count in the last 24 hours.
// Query top 10 connection errors by number of users experiencing a specific error.
// Alternatively replace "UserName" in the query by "CorrelationID" to see how often the error has occurred.
// The "CorrelationId" is unique for each connection attempt.
// The flag on "ServiceError" helps to focus on issues that are more likely mitigated by administrative tasks.
// Change the ActivityType based on the issues you are troubleshooting.
WVDErrors
| where TimeGenerated > ago(2h)
| where ServiceError == "false"
| where ActivityType == "Connection"
| summarize UserCount = dcount(UserName) by CodeSymbolic
| sort by UserCount desc
| top 10 by UserCount
| render barchart
The following are the Top 10 AVD Connection Errors that you can see from the log analytics workspace using KQL queries.
AVD Insights Dashboard – AVD Utilization Reports
You can get the Azure Virtual Desktop (AVD) insights dashboard to get an overview of the entire AVD deployments. You can get the details using the individual Resource Group and Host Pool filters. This will get you the AVD Insights Dashboard – AVD Utilization Reports.
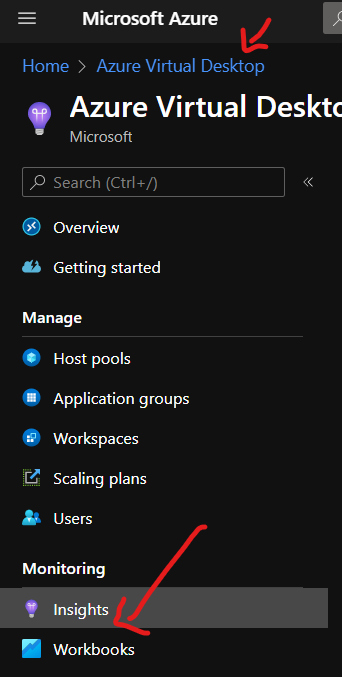
You can navigate Azure Virtual Desktop – Insights and filter on the Resource Group and Host Pool.
- Open the Portal.Azure.com.
- Navigate to Azure Virtual Desktop workflow and Click on Insights.
- Filter the insights with the correct Resource Group and Host Pool that you want to check the insights.
- Check the AVD utilization reports.
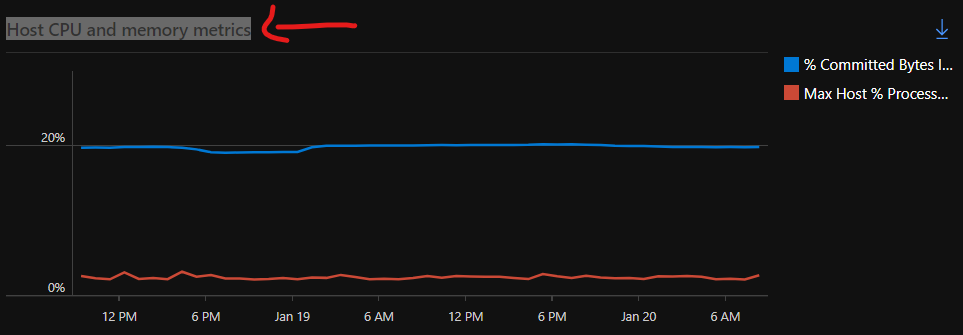
You can get the following details from AVD insights. The following are the different tabs: Overview, Connection Diagnostics, Connection Performance, Host Diagnostics, Host Performance, Users, Utilization, Clients, and Alerts.
One example is Host CPU and Memory metrics for the AVD utilization dashboard!
Log Analytics Tables for AVD
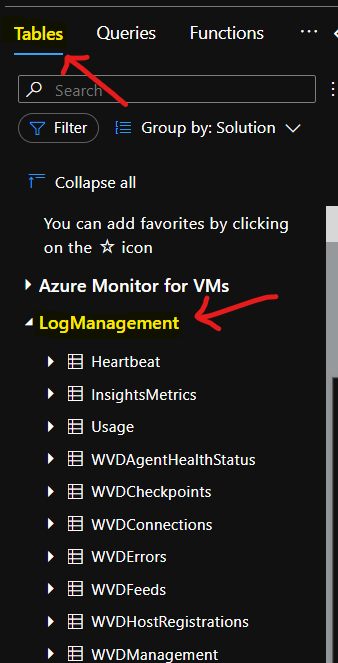
You can check the Log Analytics tables for AVD. I have provided the supported list of tables for AVD. You can use the following tables for troubleshooting AVD related issues. There is two (2) section available under Azure Monitor implementation.
- Azure Monitor for VMs
- LogManagement
The following are important tables that are used for Azure Virtual Desktop monitoring checks. You can check more details about AVD reference tables from Microsoft Docs https://docs.microsoft.com/en-us/azure/azure-monitor/reference/tables/tables-category#windows-virtual-desktop.
| Log Analytics Tables for AVD | |
| 1 | Heartbeat |
| 2 | InsightsMetrics |
| 3 | Usage |
| 4 | WVDAgentHealthStatus |
| 5 | WVDCheckpoints |
| 6 | WVDConnections |
| 7 | WVDErrors |
| 8 | WVDFeeds |
| 9 | WVDHostRegistrations |
| 10 | WVDManagement |
You can check the list of Tables available in the LogManagement section of the log analytics workspace.
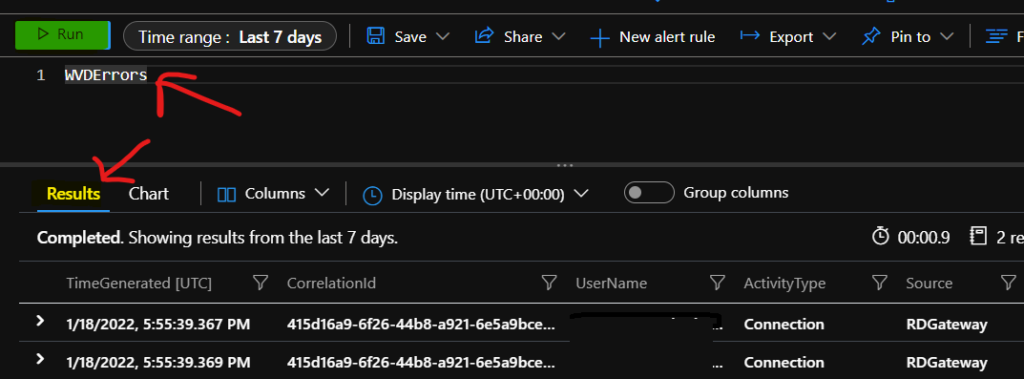
You can enter the table’s name in the query window in Log Analytics, as shown in the below screenshot. The table entries will give you the output of the latest entries of the tables related to AVD.
Azure Virtual Desktop – AVD Errors Table – WVDErrors
The WVDErrors table is useful from Azure Monitor and Log Analytics workspace. You can use the following table, “WVDErrors,” as an example to get the latest errors encountered in AVD deployment.
- Click on Log Analytics Workspace where you stored all the log data from AVD.
- Navigate to Logs blade.
- Open the Log Analytics KQL Query window.
- Type in WVDErrors and click on Run button to see the results.


Discussion